
Foundation repair contractors asking whether their margins measure up should start with an honest benchmark: verified data shows general contractors average just 5-6% net profit margins, while specialty trade contractors — the category foundation repair falls into — commonly report stronger 15-25% net margins and 20-35% gross margins. The “74% gross margin” referenced in this guide’s headline is not a single published industry statistic; no trade association tracks a universal foundation-repair-specific benchmark the way NAHB tracks homebuilders. Instead, it’s a modeled composite target built from real cost structures across crack injection, slab jacking, and piering. Understanding markup-versus-margin math and tracking five core metrics is what actually separates profitable operators from those leaving money on the table.
Before diving into the numbers, it’s worth being direct about where they come from. Unlike homebuilding — where the National Association of Home Builders (NAHB) publishes an annual Cost of Doing Business Study with hard gross and net margin figures — foundation repair has no equivalent dedicated trade association publishing standardized profitability benchmarks. That’s precisely the content gap this analysis fills.
So the “74%” figure in this piece’s title functions as an illustrative target: a modeled gross margin assembled from publicly available project-cost data (materials, per-pier pricing, crack-injection pricing, labor rates) rather than a number pulled from a single named study. Every other statistic that follows, however, is drawn from a specific, attributable source — construction financial benchmarking firms, the Bureau of Labor Statistics, NAHB, and home-services cost-guide publishers who regularly survey contractor and homeowner pricing data. Where a claim can’t be tied to a specific source, it’s flagged as illustrative rather than presented as fact.
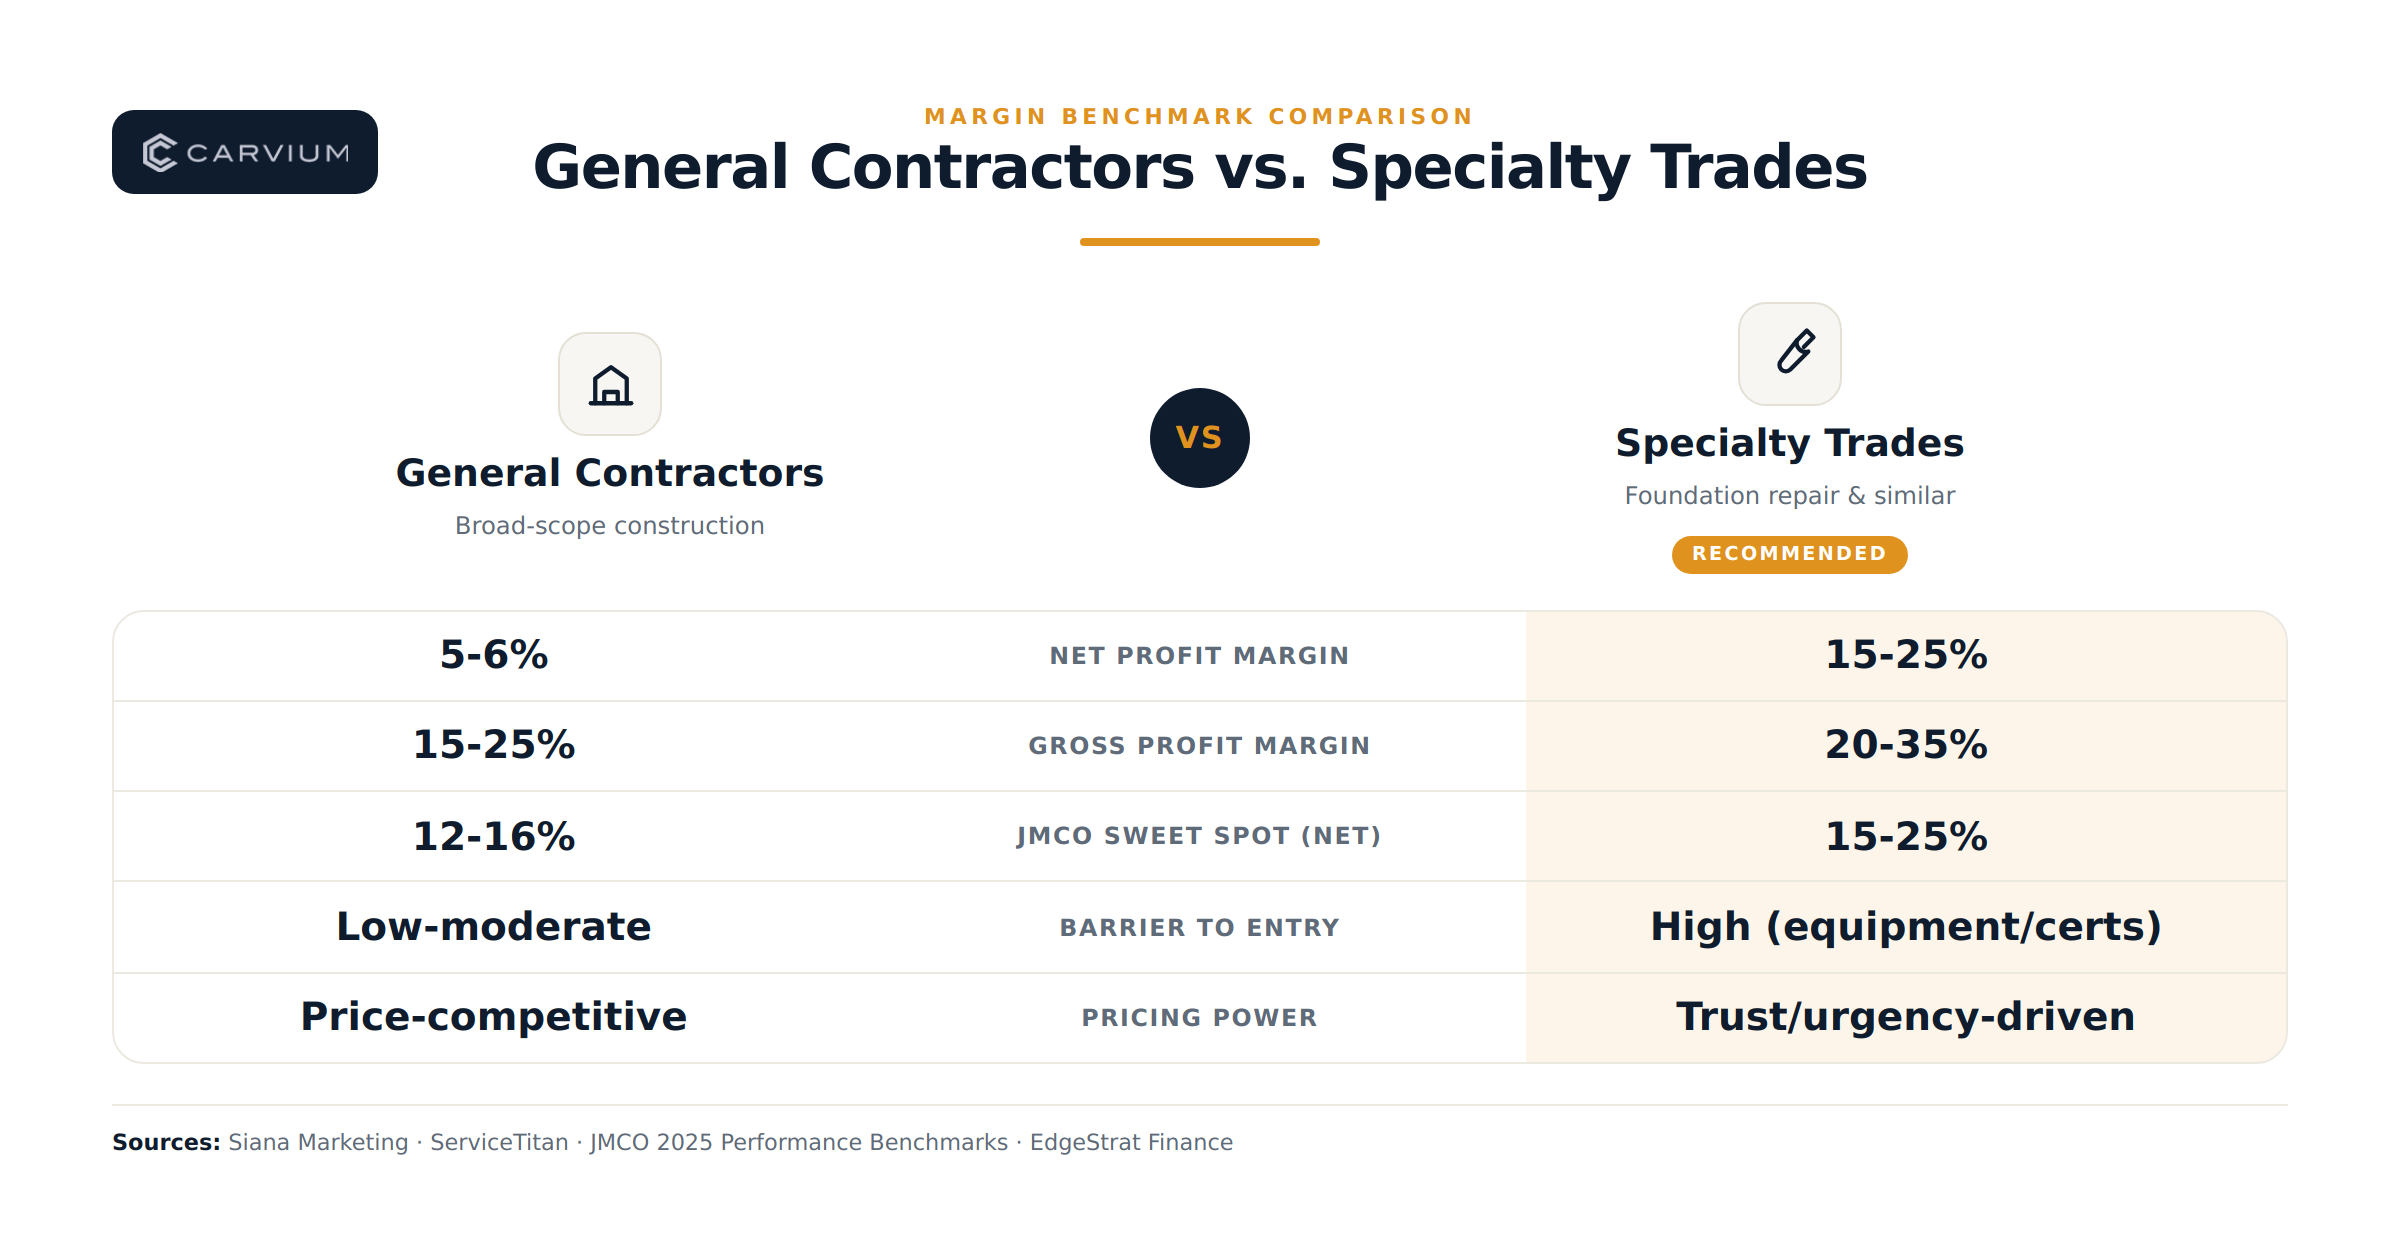
General contractors operate on famously thin margins. Siana Marketing’s 2026 General Contractor Profit Margin report puts the average net profit margin for general contractors at roughly 5-6% — a net-margin figure distinct from gross margin. For comparison, ServiceTitan’s Construction Profit Margin blog cites gross margins (not net) typically falling between 15% and 20% for general contracting firms, a figure that’s easy to conflate with net profitability if the source isn’t read carefully. NAHB’s own builder financial performance data shows the average gross profit margin for homebuilders rose from 18.2% in 2020 to 20.7% in 2023, while average net profit margin climbed from 7.0% to 8.7% over the same period — genuine improvement, but still a single-digit-to-low-teens net result.
The Construction Financial Management Association’s (CFMA) 2024 Financial Benchmarker report puts it plainly: net income before taxes across all respondents rose to 6.3% of revenue in 2024, up from 5.0% in 2022, while “Best in Class” firms achieved 11.9-12.0% — roughly five percentage points above the all-respondent average. That gap between average and top-performer is the ceiling most general contractors are fighting to close.
Specialty trade contractors — a category that includes foundation repair, waterproofing, HVAC, electrical, and plumbing specialists — consistently outperform that baseline. JMCO’s 2025 Performance Benchmarks for construction companies place the profitability “sweet spot” at 12-16% net margin for general contractors versus 15-25% net margin for specialty contractors. Separately, EdgeStrat Finance’s contractor gross margin benchmarking puts specialty trades at 20-35% gross margin, compared to 15-25% for general contractors.
Why the gap exists:
Specialization premium. Foundation repair requires specific equipment (hydraulic pier-driving rigs, injection systems), certifications, and structural knowledge that general contractors and handyman-tier competitors simply can’t replicate. That barrier to entry supports pricing power.
Urgency-driven demand. A homeowner with a visibly cracking foundation wall isn’t comparison-shopping the way they would for a kitchen remodel — they’re often making a decision under real or perceived urgency, which shifts the buying conversation toward trust and speed over price alone. The Better Business Bureau’s own contractor-hiring guidance for homeowners emphasizes checking documented credibility and track record over chasing the lowest bid — advice that applies with particular force to structural work where a bad repair can mean a home isn’t sellable.
Job value range. Foundation repair spans a wide price band — from crack injection jobs running a few hundred dollars per crack (HomeGuide cites $250-$800+ per crack, with Earth Contact Products citing a national average near $4,500 for a full injection project) up to major underpinning work averaging around $25,000 (Angi). That range lets contractors segment their business and apply different margin targets by job type, which is exactly what Section 4 below builds out.
Institutional validation. Perhaps the clearest external signal that foundation repair carries above-average margin potential: private equity has taken notice. CT Acquisitions’ 2026 Foundation Repair PE Roll-Up Tracker identifies seven active private-equity-backed platforms currently consolidating foundation repair and waterproofing contractors in the U.S. Sophisticated financial buyers generally don’t roll up fragmented, thin-margin trades — they roll up ones with pricing power and repeatable unit economics.
Putting the numbers together: if general contracting nets 5-6% on average (with CFMA’s all-respondent figure at 6.3% and top performers near 12%), specialty trades like foundation repair reasonably target 15-25% net profit margin as a realistic “healthy” range — not the sometimes-cited 74% figure, which (as explained above) describes a gross-margin composite for certain high-margin repair categories, not a documented net-margin benchmark for the trade as a whole.
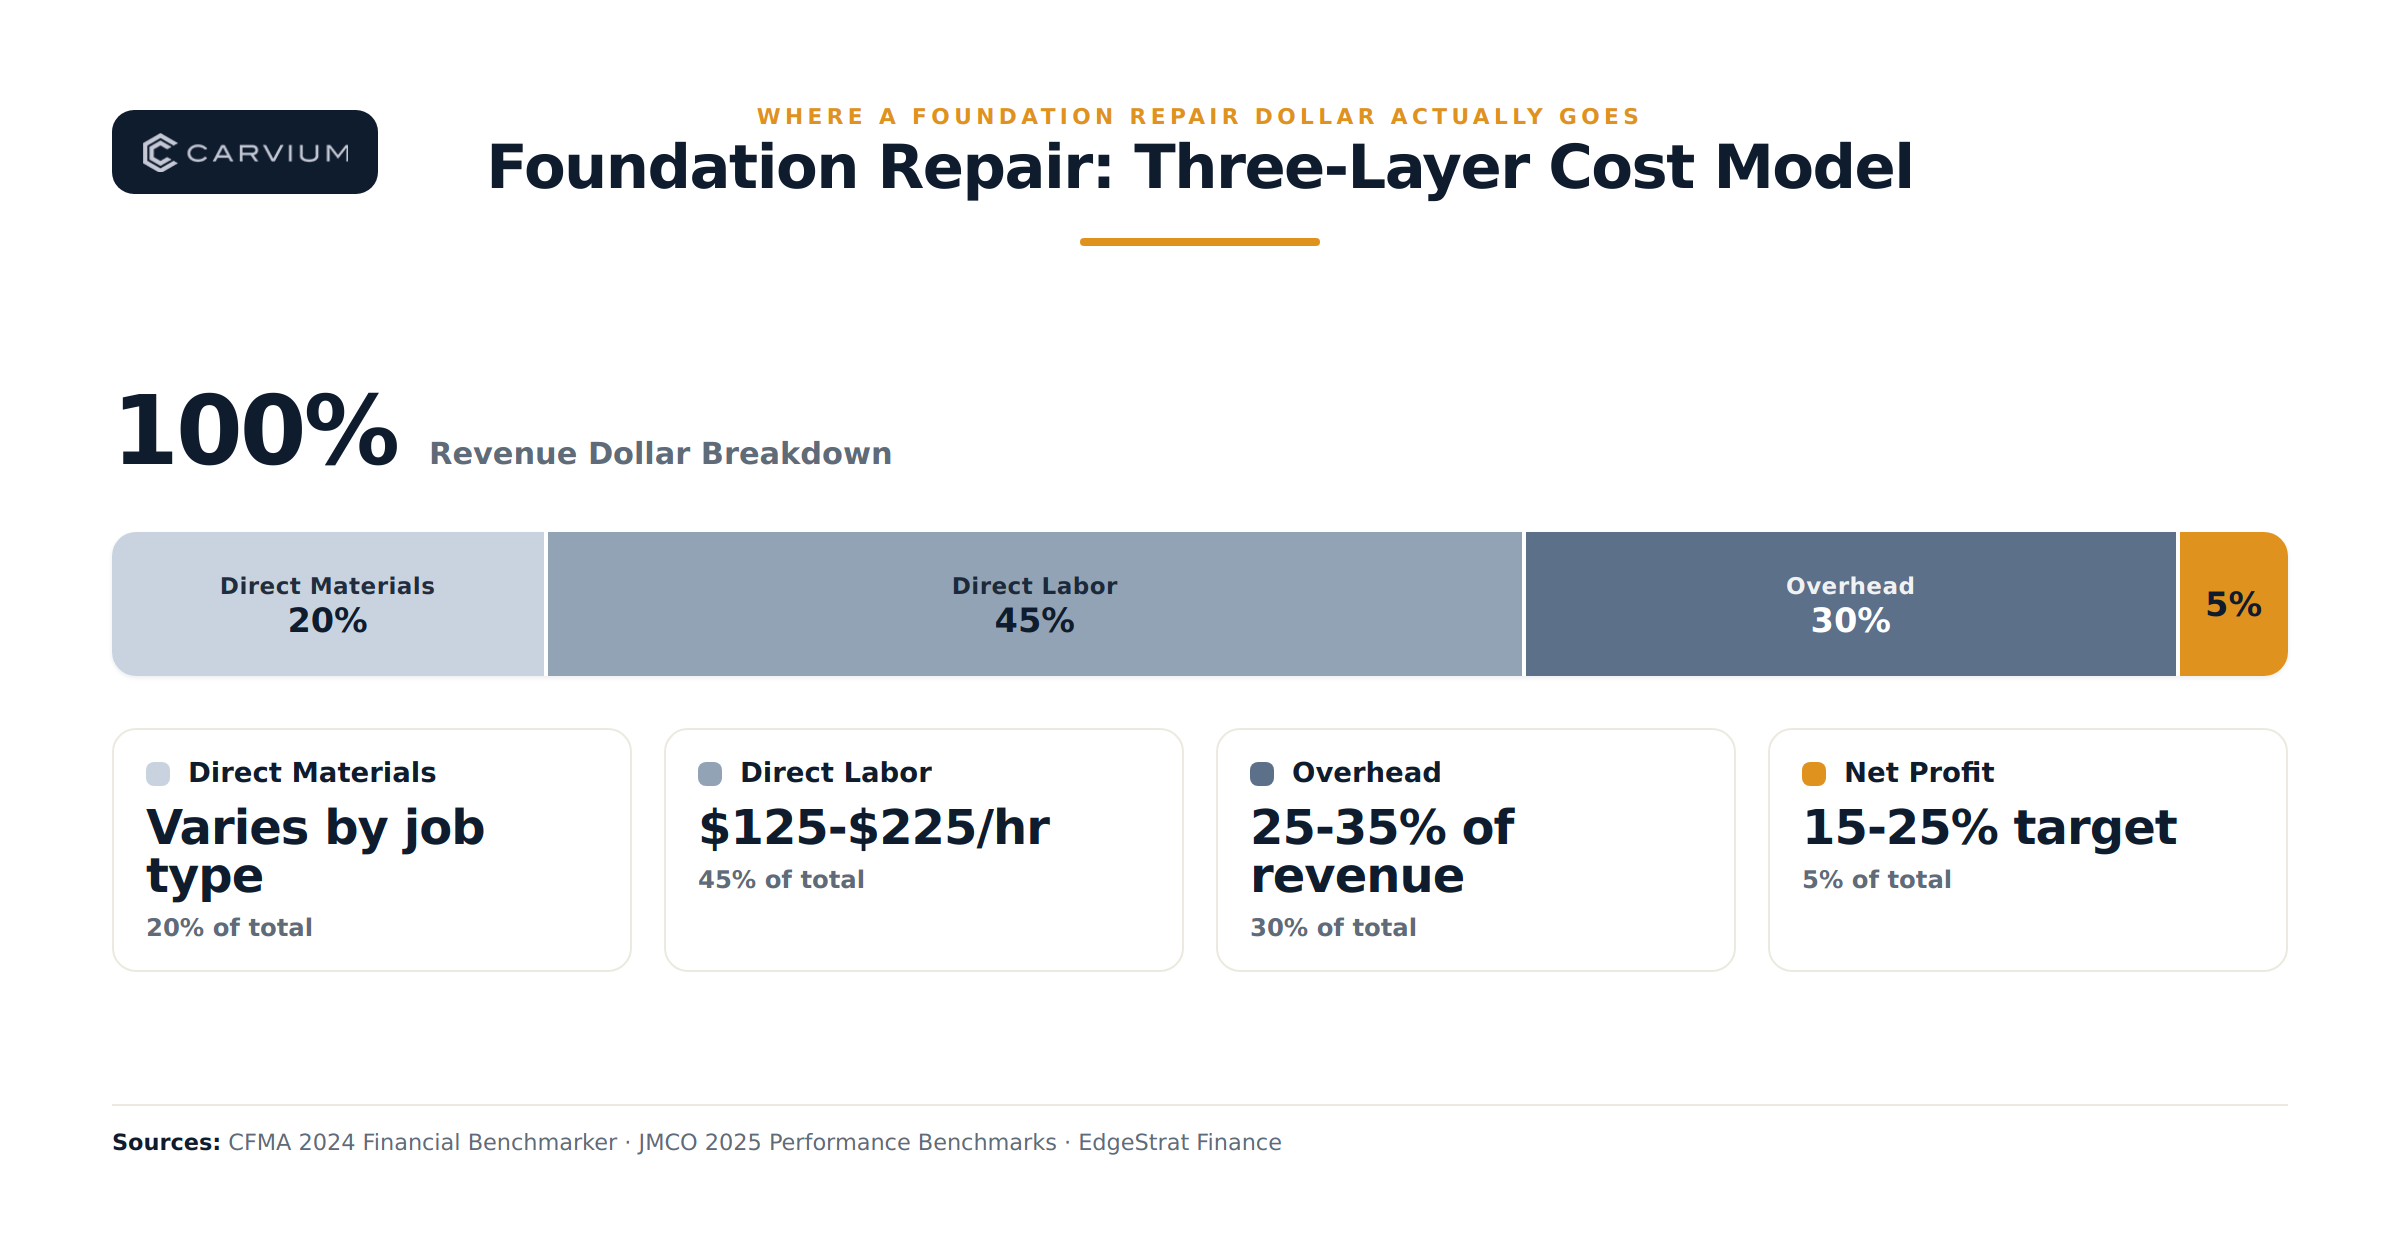
Every foundation repair job breaks down into three cost layers. Understanding each one is what lets you price accurately instead of guessing.
Layer 1: Direct Materials
Material costs vary sharply by repair type, and real project-cost data illustrates the spread clearly:
Because piering and waterproofing carry heavier material line items, contractors typically apply a material markup — commonly 20-30% over supplier cost — to cover waste, storage, and handling. That markup is a pricing lever, not a component of your labor-versus-materials cost of goods sold (COGS) calculation, and the two shouldn’t be confused.
Layer 2: Direct Labor
Labor rates for foundation repair specifically run well above general construction labor. Modernize’s 2026 cost data cites $125-$225 per hour in most markets, and This Old House cites a working figure of roughly $200 per hour for foundation repair labor — both notably higher than the Bureau of Labor Statistics’ broader figures for construction labor overall. BLS reports the median annual wage for construction laborers and helpers was $46,050 in May 2024, while the median across all construction and extraction occupations was $58,360 — useful context for understanding your loaded labor cost per hour when you build out crew wages, payroll taxes, and benefits.
The premium foundation repair labor commands over general construction wages reflects both the physical demands of the work (pier driving, excavation, structural assessment) and a documented, industry-wide skilled labor shortage. Associated Builders and Contractors (ABC) estimated the construction industry needed to attract 439,000 net new workers in 2025 alone to meet demand, and the Associated General Contractors’ (AGC) 2025 Workforce Survey found 45% of firms experiencing project delays specifically due to shortages of their own or subcontractors’ workers. Tighter labor supply pushes wages — and therefore your labor cost per hour — upward industry-wide.
Layer 3: Overhead
Overhead is everything you pay whether you have work or not — office staff, insurance, equipment payments, marketing, facilities, licensing. EdgeStrat Finance’s contractor overhead benchmarking puts typical overhead at 25-35% of revenue for contractors under $1M in annual revenue, with that percentage generally compressing as a business scales toward $2M-plus. That’s meaningfully higher than the simplified “10-10 Rule” still cited across the industry — a baseline assumption of 10% overhead plus 10% profit, or 20% total markup — which several sources (Togal.ai, Planyard, SMA Estimating) now describe as outdated for many real-world cost structures, particularly for smaller specialty operations still building volume.
Revenue − Materials − Labor − Overhead = Net Profit
Here’s an illustrative (not verified real-world) example built from the sourced ranges above, to show how the math works on a mid-size piering job:
This hypothetical sits comfortably within the 15-25% (and above) net margin range documented for specialty trades — which is the honest takeaway: real, sourced industry ranges support strong foundation repair profitability, without needing to lean on an unverifiable single benchmark number.
This is arithmetic, not opinion, and it trips up contractors constantly: markup and margin are not the same number, and confusing them quietly erodes profitability on every job.
Markup = the percentage you add on top of cost.
Margin = the percentage of the final price that is actual profit.
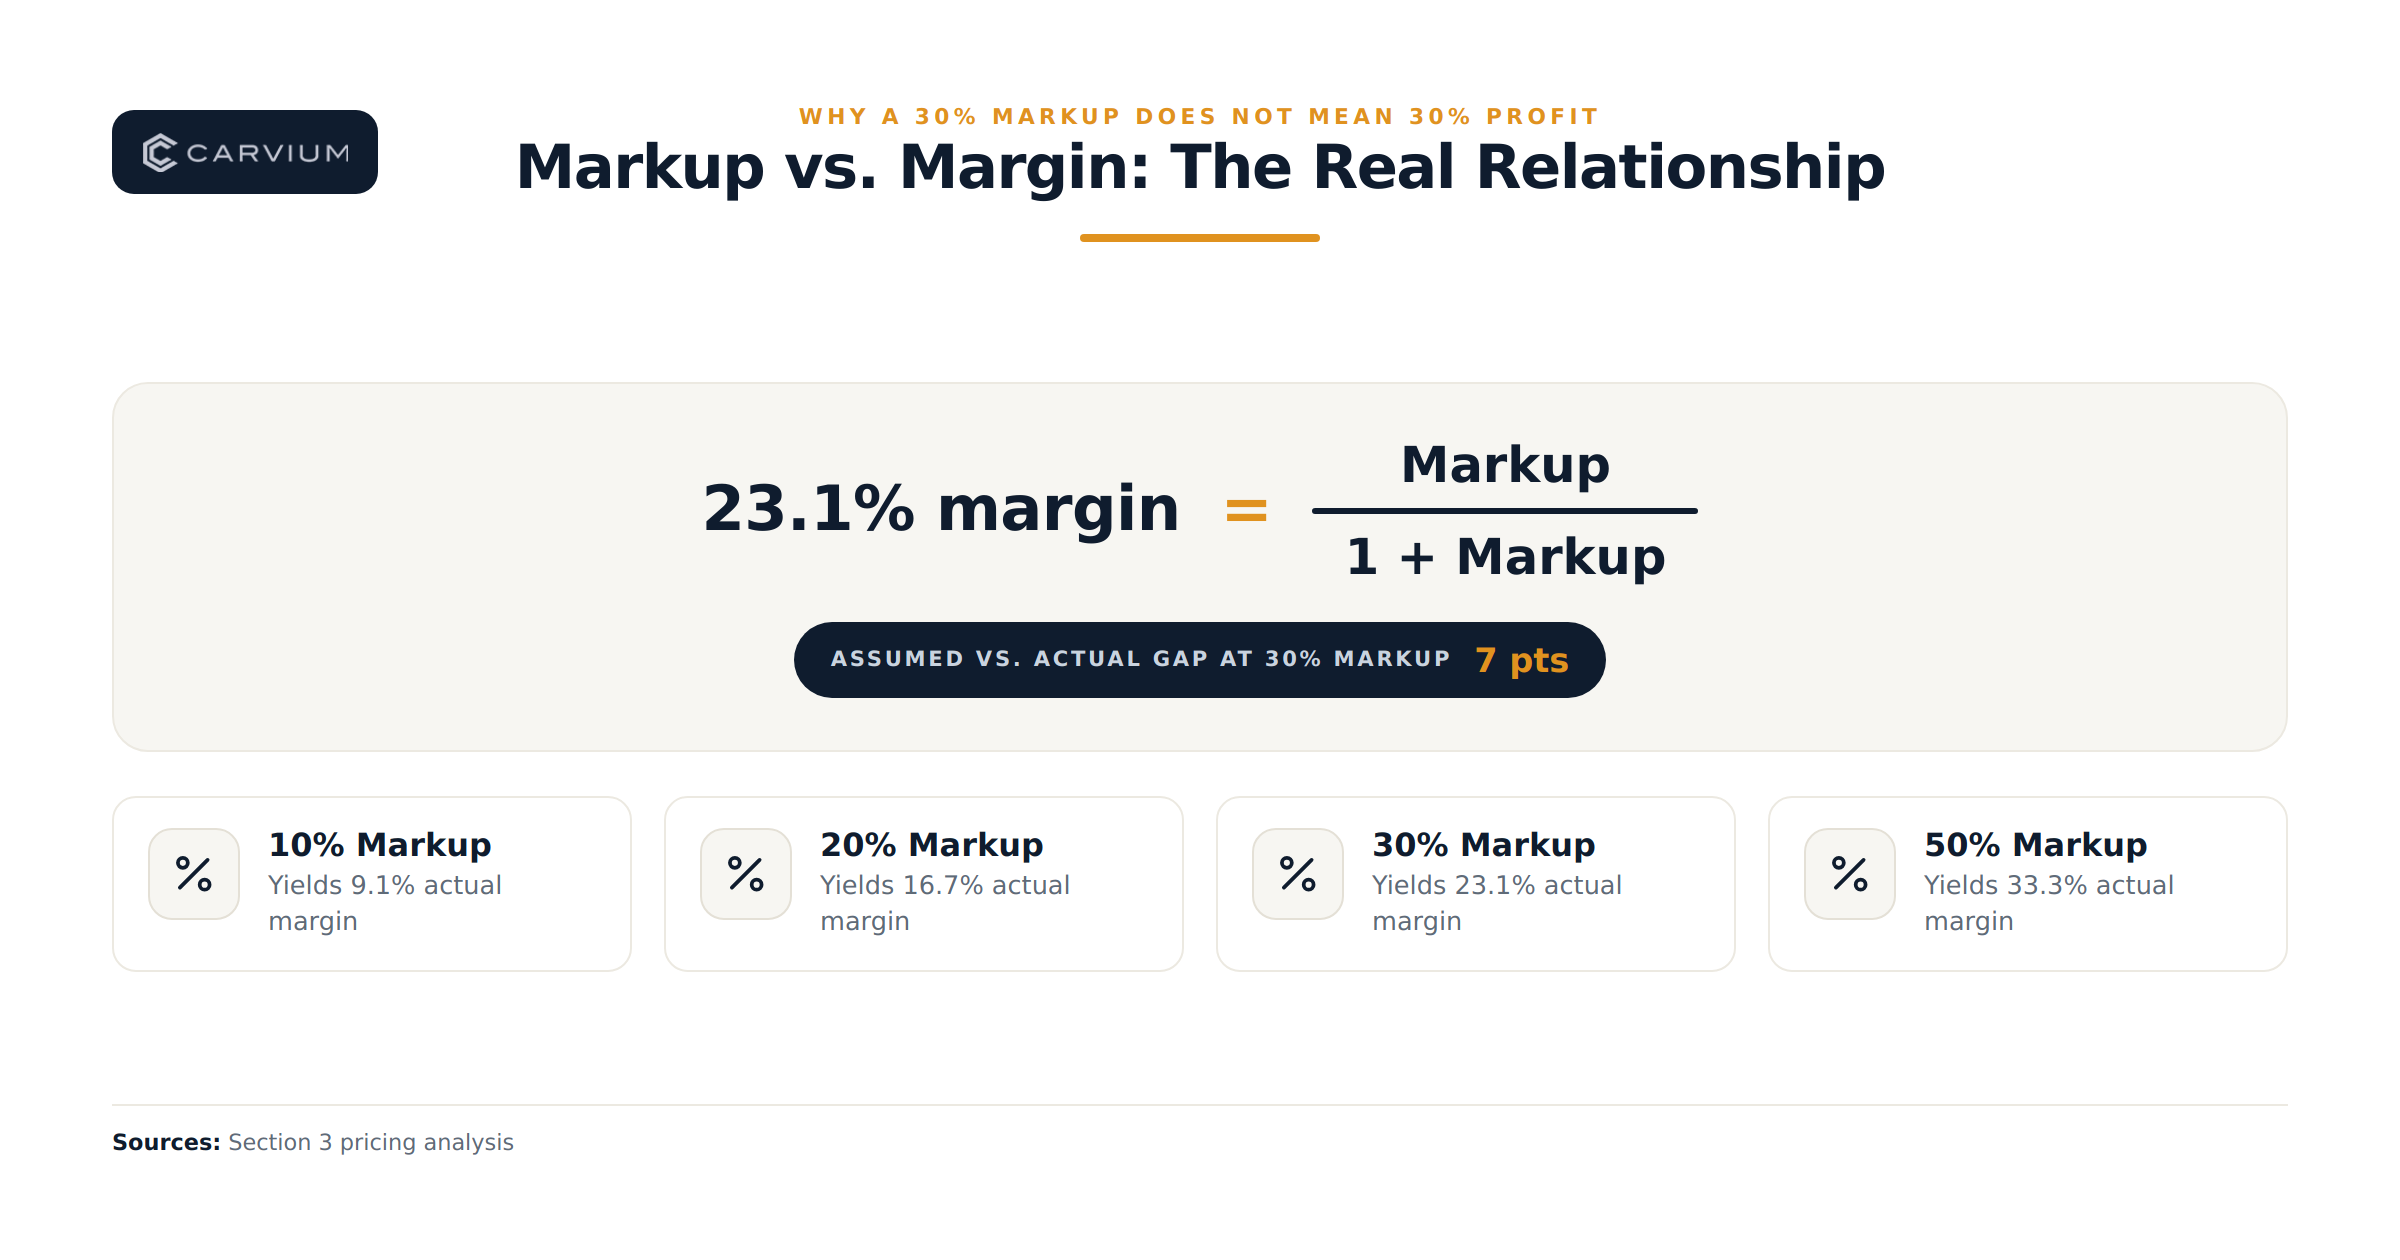
The relationship: Margin = Markup ÷ (1 + Markup)
| Markup Applied | Actual Margin Achieved |
|---|---|
| 10% | 9.1% |
| 20% | 16.7% |
| 30% | 23.1% |
| 50% | 33.3% |
| 100% | 50.0% |
A contractor who applies a 30% markup and assumes they’re keeping 30% profit is actually keeping 23.1%. Over a year of jobs, that 7-point gap between assumed and actual margin is the difference between a business that comfortably reinvests in equipment and crew, and one that quietly runs on thinner-than-planned cash flow.
Given the sourced cost data in Section 2, different repair categories reasonably support different margin targets:
High-volume, low-complexity work (crack injection): Given HomeGuide’s $250-$800+ per-crack range and relatively low material cost, this category can typically support the highest margins in the trade — the labor-to-material ratio favors the contractor once diagnostic and travel time are accounted for.
Mid-range work (slab jacking / mudjacking): With material and equipment costs consuming a larger share of Angi and HomeGuide’s cited $3-$9 per square foot pricing, margins here typically run more moderate than crack repair, though still favorable versus general construction.
Complex structural work (piering, underpinning): Given the $1,100-$4,000 per-pier cost bands cited by Angi, Olshan, and HomeGuide, and the longer project duration (multi-day jobs per Modernize), this category carries the highest absolute material cost and the most execution risk — appropriately, it should target a lower percentage margin but the highest total profit dollars per job.
When a competing quote comes in 30-40% below yours, the arithmetic above suggests they are very likely doing one of the following: underestimating labor hours, cutting material specification (a cheaper epoxy, a thinner slurry mix, fewer piers than the job actually requires), or simply not allocating overhead into the bid at all. None of these are sustainable business practices — and warranty terms are often where the gap shows up. Reputable foundation repair contractors typically offer warranties ranging from several years to a lifetime, transferable to future homeowners, according to multiple industry warranty guides (DryBasement, HD Foundation Repair, Attack-a-Crack). A dramatically underpriced competitor frequently can’t back a comparable warranty because their pricing doesn’t leave room for future claims — a concrete, verifiable point of differentiation you can raise directly with a homeowner comparing quotes.
Track this separately for crack injection, slab jacking, piering, and waterproofing. Given the cost structures in Section 2, specialty-trade gross margin benchmarks of 20-35% (EdgeStrat Finance) represent a reasonable floor across categories, with crack repair supporting the high end and piering the lower end of that range.
Using Modernize’s $125-$225/hour foundation-repair-specific labor rate alongside BLS wage data as a sanity check on your loaded cost per hour, a labor cost consistently exceeding roughly 30-35% of job revenue signals either underpricing or scheduling inefficiency worth investigating.
Given the sourced material cost ranges above, materials consistently running above 30-35% of revenue on non-piering jobs is worth a second look — either your material sourcing needs renegotiating, or your pricing hasn’t kept pace with supplier costs.
Calculate: monthly overhead ÷ jobs completed per month. EdgeStrat Finance’s benchmark of 25-35% overhead for contractors under $1M in revenue means a business completing 8 jobs a month with $8,000 in monthly overhead should be building roughly $1,000 in overhead recovery into every estimate — a step many growing contractors skip.
Calculate: (Total Revenue − Total Costs) ÷ Total Revenue. Based on the JMCO and EdgeStrat Finance specialty-trade benchmarks cited above, 15-25% net margin represents a defensible, sourced target range for a foundation repair business — well above the 5-6% general contracting average, and consistent with why private equity platforms have moved into this space.
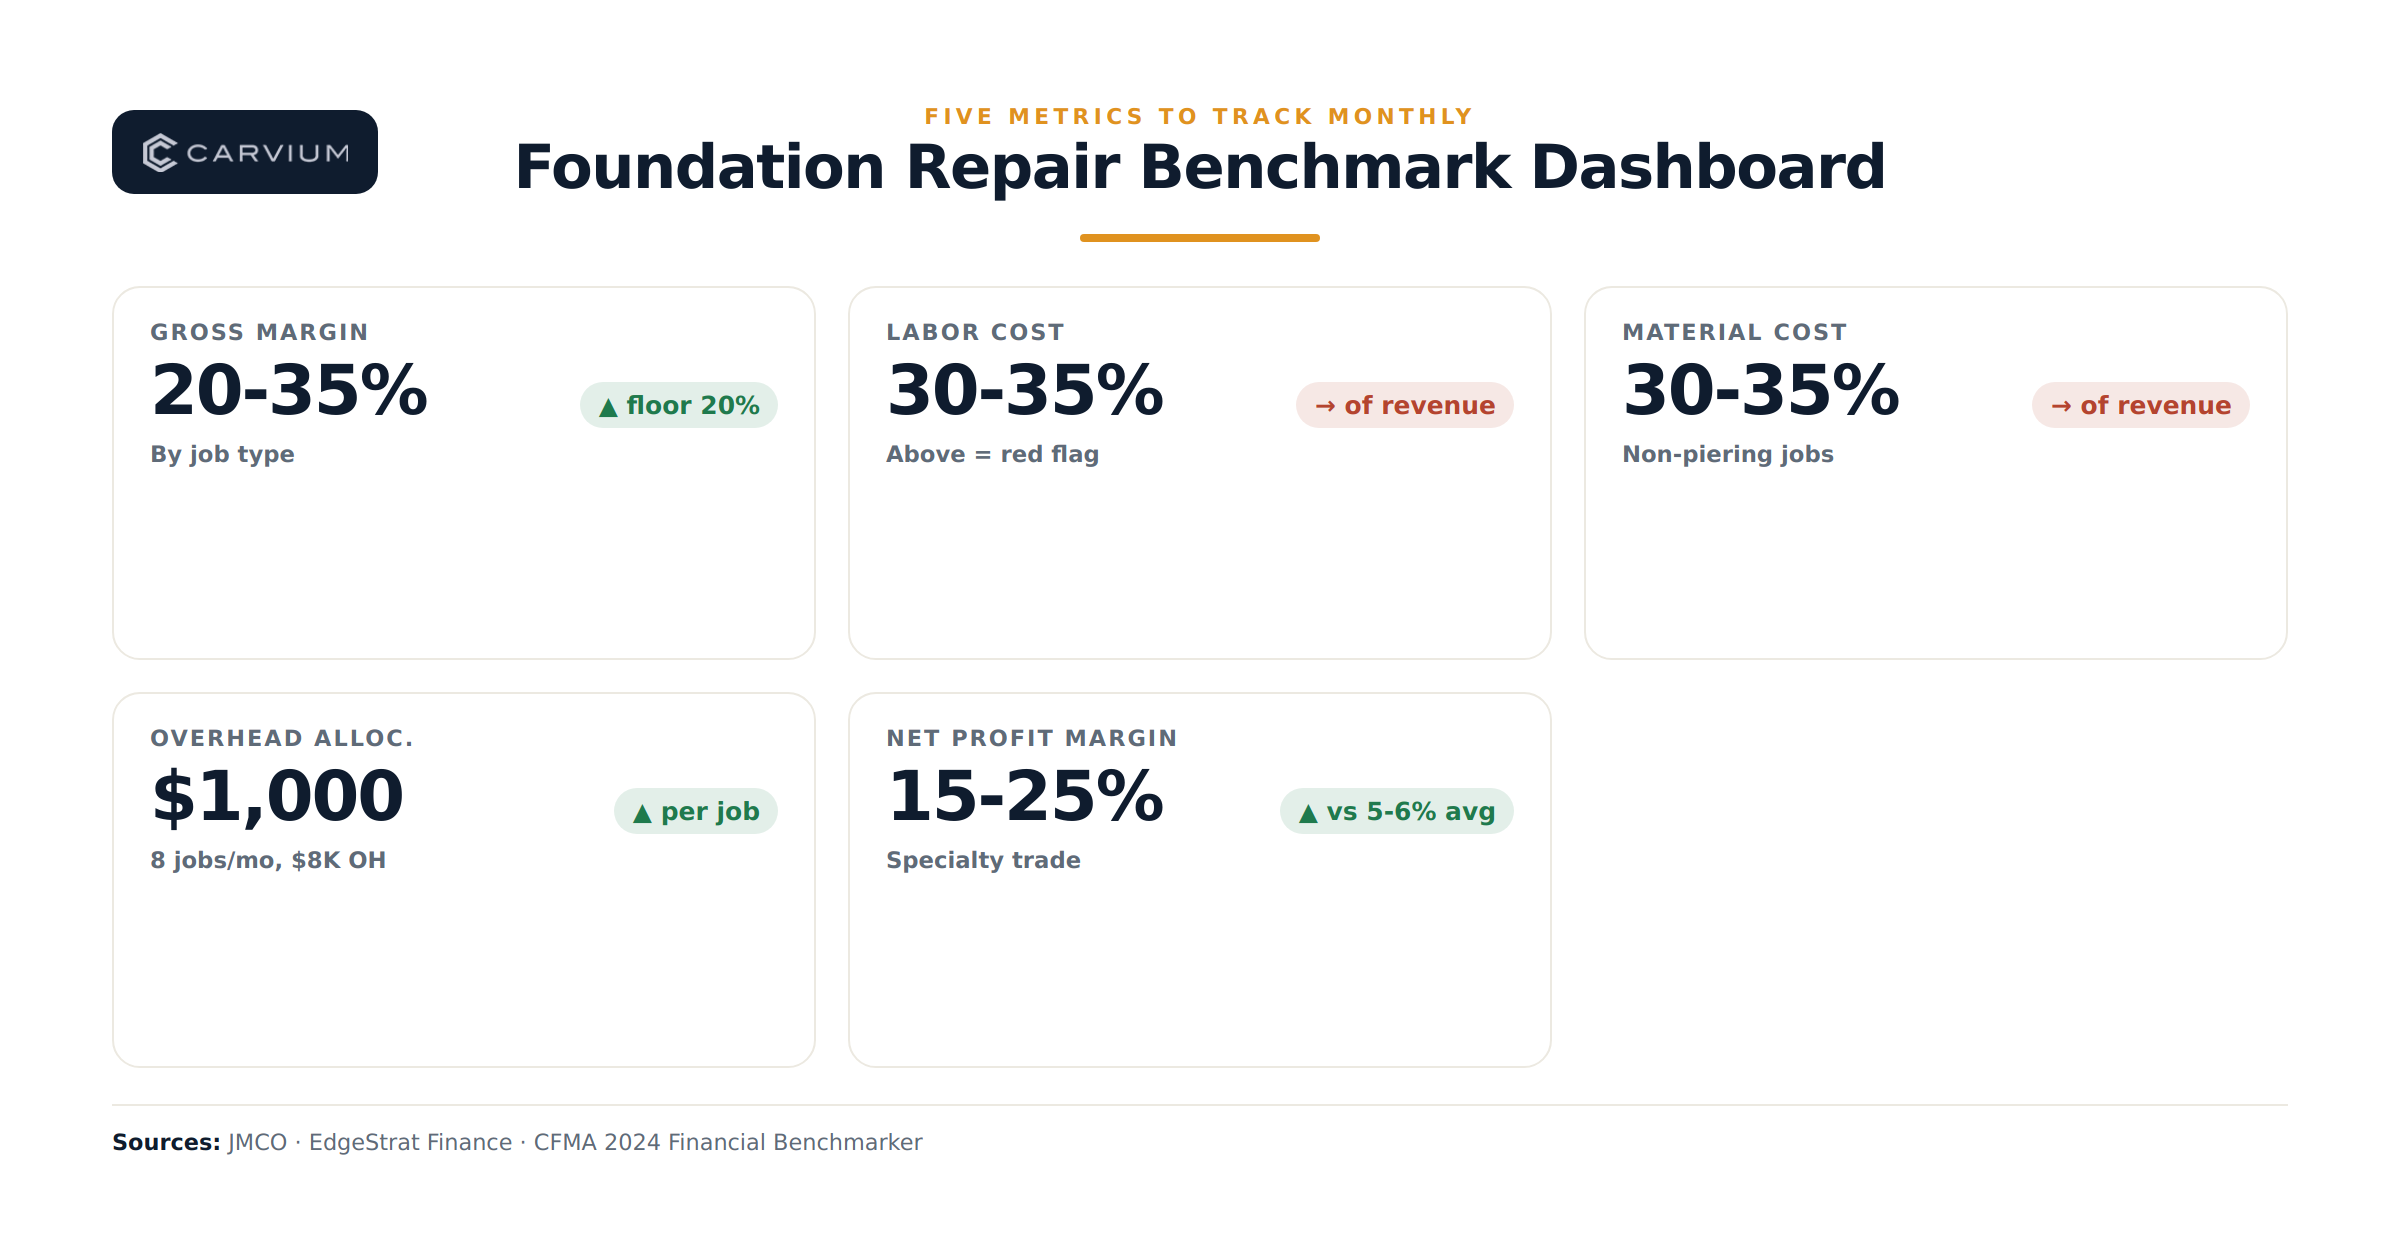
At minimum, track revenue, materials, labor, and overhead monthly, broken out by job type. The goal isn’t a single “correct” number — it’s catching a slipping metric before a full quarter of underpriced jobs erodes your cash position.
Identify which job category (per Metric 1) is underperforming its sourced benchmark range, and test price increases there first — 10-15% increments, tracked against close rate. If your close rate holds, you found real margin. When you raise prices, communicate the value shift explicitly: warranty length and transferability, crew certification, or upgraded materials are all legitimate, sourced-in-your-own-business talking points that justify a homeowner paying more than the low bid.
Given that piering materials represent the largest single cost category (per Angi and HomeGuide’s per-pier data), negotiating volume pricing with 2-3 preferred suppliers has the highest leverage of any cost-control move available to a growing foundation repair business.
With ABC citing a need for 439,000 new construction workers in 2025 and AGC reporting 45% of firms facing shortage-driven delays, labor availability — not just labor cost — is a real constraint. Standardizing crew composition and reducing drive time between jobs is one of the few levers a contractor fully controls in a tight labor market; every hour saved on a $175-$200/hour crew is direct margin.
Multiple 2026 marketing-cost analyses (LeadTruffle, The Valley Marketing Group, Mankato Web Design) cite Angi and HomeAdvisor lead costs of $15-$120+ per lead — and because these platforms commonly sell the same lead to multiple competing contractors simultaneously, the effective cost per booked job frequently exceeds $1,000-$1,400. Compare that to referral-driven business: referral-marketing research tracing back to Deloitte’s customer analytics — widely cited across referral-platform benchmarking reports — indicates referred customers show meaningfully higher lifetime value and roughly 37% higher retention than non-referred customers. More directly relevant to this trade, GetTheReferral’s home-services referral analytics reports that home service contractors typically close 30-50% of referral leads, compared to just 8-15% from marketplace-sourced leads — a materially cheaper and higher-converting acquisition channel than paid lead marketplaces.
Given that overhead can run 25-35% of revenue for smaller contractors (EdgeStrat Finance), even modest overhead reductions — renegotiated insurance, right-sized administrative staffing — compound directly into net margin, since overhead sits below the gross-margin line where most contractors already focus their attention.
Foundation repair has real, sourced profit potential — general contracting’s 5-6% average isn’t your ceiling, and the specialty-trade range of 15-25% net margin is well within reach for operators who price by job category and track the five metrics above. But the honest starting point is separating verified industry data from convenient round numbers: there is no single published “74% industry standard” for this trade, and pretending otherwise undermines the credibility this analysis is built to establish.
This month, take three concrete actions: pull your last 10 completed jobs and calculate actual gross and net margin by repair category using the cost breakdowns in Section 2; calculate your true overhead allocation per job and confirm it’s built into every estimate; and test a 10-15% price increase on your lowest-margin service line while tracking close rate. Foundation repair contractors who price from real cost data — not assumed markup — are the ones capturing the margin this trade genuinely supports.